
Two colleagues begin investing on the same day in January 2016.
Both invest ₹10,000 per month. Both are disciplined – not a single SIP missed in 10 years.
By January 2026, one has a corpus of ₹23.4 lakhs. The other has ₹31.8 lakhs.
Same monthly investment. Same ten years. Same discipline.
The difference: one chose a large-cap fund delivering 12% CAGR. The other chose a flexi-cap fund delivering 16% CAGR. A 4% difference in annual return – compounded over 10 years – created a gap of ₹8.4 lakhs from identical contributions.
Now extend this to 20 years. The same 4% return difference produces a gap of ₹68 lakhs on the same ₹10,000/month investment.
This is why the mutual fund you choose matters enormously – far more than most investors realise. And it is exactly why the mutual fund returns calculator exists: to show you, in precise numbers, what different fund categories actually deliver – so you choose based on data rather than advice from someone who earns a commission from your choice.
Here is the complete 2026 guide to comparing every major mutual fund type – with real historical returns, real risk data, and the exact framework to match your investment to your goal.
👉 Compare returns across all mutual fund categories with our free Mutual Fund Returns Calculator →
What Is a Mutual Fund Returns Calculator?
A mutual fund returns calculator projects the future value of your investment – whether SIP (monthly) or lumpsum (one-time) – based on an expected annual return rate for any given fund category.
Unlike a simple compound interest calculator, a sophisticated mutual fund returns calculator:
- Compares returns across multiple fund categories simultaneously
- Accounts for expense ratio impact on net returns (the most overlooked factor)
- Shows rolling returns – not just point-to-point performance
- Adjusts for inflation to show real purchasing power of the corpus
- Calculates CAGR (Compound Annual Growth Rate) from actual NAV history
Core Returns Formula:

Future Value (SIP):
FV = P × [(1 + r)^n - 1] ÷ r × (1 + r)

Where:
P = Monthly SIP amount
r = Monthly return rate (annual CAGR ÷ 12)
n = Number of months

Example: ₹10,000/month, 14% CAGR, 15 years
r = 14% ÷ 12 = 1.167%/month
n = 180 months
FV = ₹10,000 × [(1.01167)^180 - 1] ÷ 0.01167 × 1.01167
FV = ₹81,44,262
👉 Run this calculation for your exact SIP amount and fund category with our free Mutual Fund Returns Calculator →
All Mutual Fund Categories: Complete Return and Risk Guide
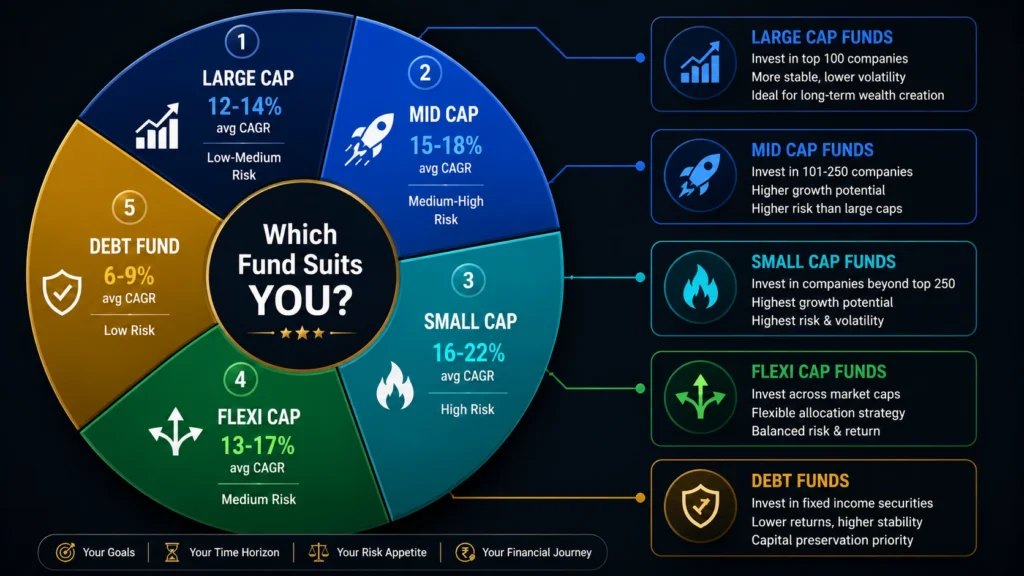
Understanding what each fund category actually delivers – based on historical data – is the foundation of informed investing:
Equity Fund Categories
| Fund Category | 5-Year CAGR | 10-Year CAGR | 15-Year CAGR | Risk Level | Best For |
|---|---|---|---|---|---|
| Large Cap | 13.2% | 12.8% | 13.5% | Medium | Conservative equity investors, 5yr+ horizon |
| Large and Mid Cap | 16.1% | 14.9% | 15.2% | Medium-High | Balanced growth, 7yr+ horizon |
| Mid Cap | 22.4% | 17.3% | 17.8% | High | Aggressive investors, 10yr+ horizon |
| Small Cap | 26.8% | 18.9% | 19.4% | Very High | Very aggressive, 10yr+ horizon, high risk tolerance |
| Flexi Cap | 17.8% | 15.4% | 15.8% | Medium-High | Most investors – fund manager picks allocation |
| ELSS (Tax Saving) | 16.9% | 14.7% | 15.3% | Medium-High | Tax saving under Section 80C + wealth building |
| Sectoral/Thematic | 15-35% (varies) | Highly variable | Highly variable | Very High | Experienced investors only – high conviction bets |
| Index Fund (Nifty 50) | 14.1% | 12.4% | 13.2% | Medium | Cost-conscious investors – no fund manager risk |
Debt and Hybrid Fund Categories
| Fund Category | 3-Year CAGR | 5-Year CAGR | Risk Level | Best For |
|---|---|---|---|---|
| Liquid Fund | 6.8% | 6.5% | Very Low | Emergency fund, parking short-term money |
| Short Duration Debt | 7.2% | 7.0% | Low | 1-3 year goals |
| Corporate Bond Fund | 7.8% | 7.5% | Low-Medium | 3-5 year goals with some yield pickup |
| Gilt Fund | 8.1% | 7.2% | Medium (rate risk) | Interest rate play; not for regular investors |
| Aggressive Hybrid | 14.2% | 12.8% | Medium | First-time equity investors; balanced allocation |
| Balanced Advantage | 12.1% | 11.4% | Medium | Dynamic allocation; reduces equity risk |
Historical returns as of January 2026. Category averages based on AMFI-reported data. Past returns do not guarantee future performance.
The Expense Ratio Impact: The Factor That Costs You Crores
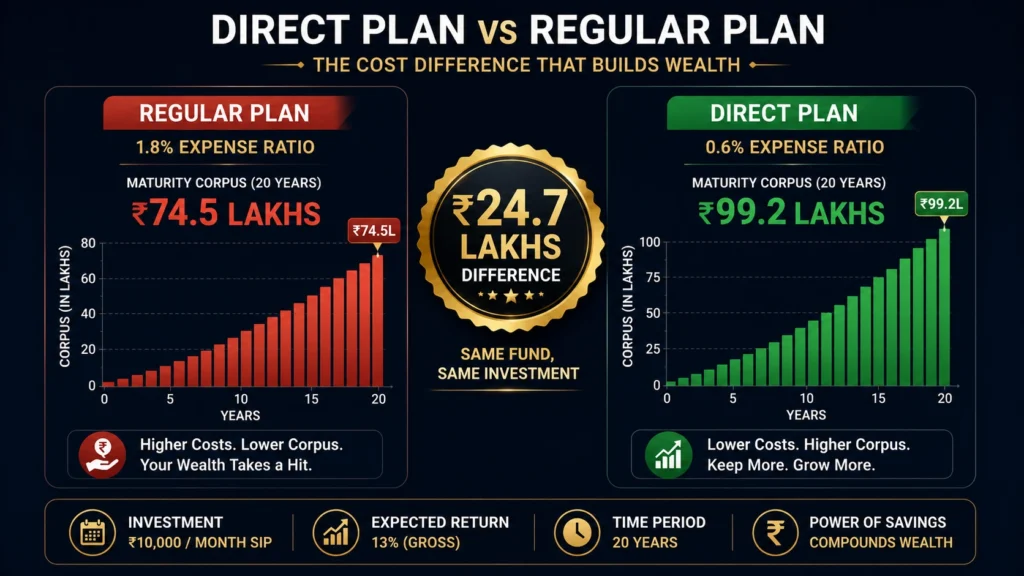
Most mutual fund investors focus entirely on return percentages and completely ignore expense ratio – the annual fee deducted from your fund’s NAV every day. This is the single most expensive mistake in mutual fund investing.
Expense Ratio Impact Over 20 Years:

Investment: ₹10,000/month SIP
Gross Fund Return: 14% CAGR

Regular Plan (Expense Ratio: 1.8%):
Net Return: 14% - 1.8% = 12.2%
20-Year Corpus: ₹87,46,000

Direct Plan (Expense Ratio: 0.6%):
Net Return: 14% - 0.6% = 13.4%
20-Year Corpus: ₹1,06,39,000

Difference: ₹18,93,000 - from the SAME fund,
SAME investment, SAME 20 years
This is not a small difference. ₹18.93 lakhs is nearly 16 years of the investor’s monthly SIP contribution – lost entirely to the distribution commission embedded in the regular plan’s higher expense ratio.
Direct vs Regular Plan: The Core Difference
| Feature | Direct Plan | Regular Plan |
|---|---|---|
| Expense Ratio | 0.3-0.8% (equity) | 1.2-2.5% (equity) |
| Who It Suits | Self-directed investors | Those needing advisor guidance |
| Where to Buy | AMC website, Zerodha, Groww, Kuvera | Banks, distributors, mutual fund agents |
| Annual Cost Difference | – | 0.8-1.5% extra per year |
| 20-Year Corpus Difference | Higher by ₹15-25 lakhs | Lower by ₹15-25 lakhs |
| Recommendation | Strong – for investors who research | Only if genuine advisor value adds more than cost |
The rule: Unless your mutual fund advisor is actively adding value through personalised portfolio review, tax-loss harvesting, and goal-based rebalancing worth more than 1% of your corpus annually – always choose Direct Plans.
Real Returns Comparison: ₹10,000 Monthly SIP Across All Categories
| Fund Category | Expected CAGR | 5-Year Corpus | 10-Year Corpus | 20-Year Corpus | Total Invested |
|---|---|---|---|---|---|
| Liquid Fund | 6.5% | ₹7,14,000 | ₹16,77,000 | ₹46,20,000 | ₹6L / ₹12L / ₹24L |
| Short Debt | 7.0% | ₹7,21,000 | ₹17,31,000 | ₹49,94,000 | Same |
| Aggressive Hybrid | 12% | ₹8,16,000 | ₹22,67,000 | ₹98,93,000 | Same |
| Large Cap (Index) | 13% | ₹8,38,000 | ₹23,93,000 | ₹1,10,61,000 | Same |
| Large Cap (Active) | 14% | ₹8,60,000 | ₹25,26,000 | ₹1,23,45,000 | Same |
| Flexi Cap | 15% | ₹8,83,000 | ₹26,67,000 | ₹1,37,68,000 | Same |
| Mid Cap | 17% | ₹9,30,000 | ₹29,70,000 | ₹1,70,18,000 | Same |
| Small Cap | 19% | ₹9,81,000 | ₹33,06,000 | ₹2,09,22,000 | Same |
The difference between a liquid fund (6.5%) and a small cap fund (19%) over 20 years on the same ₹10,000/month SIP: ₹1,63,02,000 – nearly ₹1.63 crore from the same monthly commitment. This is the mathematical argument for equity investing – and the argument for choosing the right equity category for your risk tolerance and time horizon.
Critical caveat: Small cap’s potential ₹2.09 crore corpus comes with years where the portfolio falls 40-60%. Investors who panic and exit during downturns never reach the 19% long-term CAGR. The return is real only for investors who stay invested through every market cycle.
👉 Related Reading: How to Become a Millionaire with SIP Calculator → – the complete guide to building crore-level wealth through consistent SIP.
The Goal-to-Fund Matching Framework
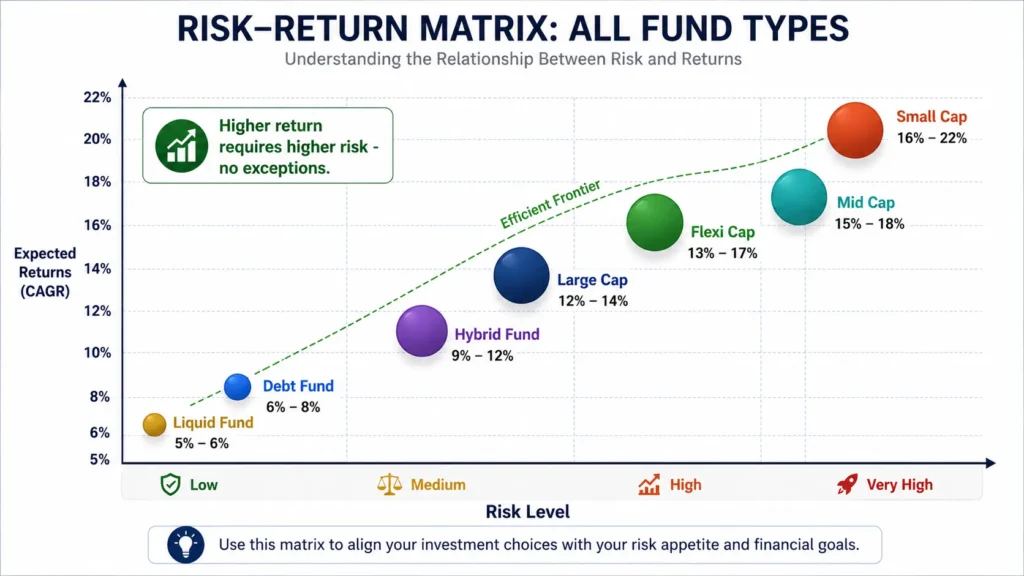
The most important mutual fund question is not “which fund has the best return?” – it is “which fund matches my specific goal, timeline, and risk tolerance?”
| Investment Goal | Timeline | Recommended Fund Category | Expected CAGR |
|---|---|---|---|
| Emergency fund | Anytime access | Liquid Fund | 6-7% |
| Vacation savings | 1-2 years | Short Duration Debt | 7-8% |
| Car purchase | 3-4 years | Corporate Bond or Aggressive Hybrid | 8-12% |
| Child’s education | 8-12 years | Flexi Cap or Large Cap | 13-15% |
| Home down payment | 5-7 years | Balanced Advantage or Large Cap | 11-13% |
| Retirement corpus | 15-25 years | Mid Cap + Large Cap combination | 14-16% blended |
| Tax saving (80C) | Minimum 3 years | ELSS Fund | 14-17% |
| Wealth multiplication | 10+ years | Mid Cap or Small Cap allocation | 16-19% |
The Asset Allocation Rule by Age:
Equity Allocation % = 100 - Your Age (Conservative)
or
Equity Allocation % = 110 - Your Age (Moderate)

Age 25: 75-85% equity mutual funds, 15-25% debt funds
Age 35: 65-75% equity, 25-35% debt
Age 45: 55-65% equity, 35-45% debt
Age 55: 40-50% equity, 50-60% debt
Age 65+: 20-30% equity, 70-80% debt
As retirement approaches – gradually shift from mid cap and small cap (high return, high volatility) toward large cap and hybrid funds (moderate return, lower volatility) to protect the accumulated corpus from large market swings.
How to Read Mutual Fund Returns: CAGR vs Absolute vs XIRR
Most investors misread their mutual fund returns because they use the wrong metric. Here is the definitive guide:
CAGR (Compound Annual Growth Rate):
The annualised return rate that takes compounding into account. Best for comparing funds over equal periods.
CAGR = (Current Value ÷ Initial Value)^(1/Years) - 1
Example: ₹1,00,000 grows to ₹2,71,000 in 10 years
CAGR = (2,71,000 ÷ 1,00,000)^(1/10) - 1 = 10.5%
Absolute Return:
Total percentage gain without considering time. Misleading for comparing different period investments.
Absolute Return = (Current Value - Invested Amount) ÷ Invested Amount × 100
Example: Invest ₹1,00,000, current value ₹1,85,000
Absolute Return = 85% (but how long did it take? 3 years or 15 years?)
XIRR (Extended Internal Rate of Return):
The most accurate metric for SIP investments where money goes in at different times. Shows the actual annualised return on your specific investment schedule.
For a 5-year SIP of ₹10,000/month totalling ₹6,00,000
that is now worth ₹8,16,000:
XIRR = approximately 12.4% - this is your true return
(Not the fund's 14% CAGR - because early SIPs had less time to compound)
Always use XIRR to evaluate your actual SIP performance – not the fund’s advertised CAGR. Your XIRR will always be lower than the fund’s long-term CAGR for SIP investments, because the most recent SIP instalments have had the least time to compound.
Top Performing Fund Categories: 10-Year Analysis
Based on AMFI category average data through January 2026:
| Category | 1-Year Return | 3-Year CAGR | 5-Year CAGR | 10-Year CAGR | Consistency Score |
|---|---|---|---|---|---|
| Small Cap | 31.2% | 24.8% | 26.8% | 18.9% | Medium (volatile) |
| Mid Cap | 26.4% | 20.1% | 22.4% | 17.3% | Medium-High |
| Flexi Cap | 19.8% | 16.4% | 17.8% | 15.4% | High |
| Large and Mid Cap | 21.2% | 17.1% | 16.1% | 14.9% | High |
| Large Cap | 16.1% | 14.2% | 13.2% | 12.8% | Very High |
| ELSS | 18.9% | 15.8% | 16.9% | 14.7% | High |
| Index (Nifty 50) | 14.8% | 13.1% | 14.1% | 12.4% | Very High |
| Aggressive Hybrid | 15.2% | 13.6% | 14.2% | 12.8% | Very High |
The consistency observation: Large cap and index funds show the highest consistency – their 1-year, 5-year, and 10-year returns are relatively close to each other, meaning investors rarely experience extreme disappointment. Small cap and mid cap show significantly higher returns but also higher variance – some years they outperform by 20%, other years they underperform by 30%.
Mutual Fund Returns Across Developing Markets
India’s mutual fund ecosystem is among the most sophisticated in the developing world – but comparable products exist across all target markets:
| Country | Equivalent Product | Regulator | Avg Equity Return (10yr) | Key Platform |
|---|---|---|---|---|
| 🇮🇳 India | Mutual Funds (AMFI) | SEBI | 12-19% | Groww, Zerodha, Kuvera |
| 🇵🇭 Philippines | UITF (Unit Investment Trust Funds) | BSP | 8-14% | BDO, BPI, Metrobank |
| 🇳🇬 Nigeria | Unit Trusts, Mutual Funds | SEC Nigeria | 10-18% (NGN) | Stanbic IBTC, ARM, Meristem |
| 🇧🇷 Brazil | Fundos de Investimento | CVM | 8-16% (BRL) | XP, BTG Pactual, NuInvest |
| 🇰🇪 Kenya | Unit Trusts | CMA Kenya | 9-15% (KES) | CIC, Britam, Sanlam |
| 🇵🇰 Pakistan | Mutual Funds | SECP | 12-20% (PKR) | Al Meezan, UBL, NBP |
India’s SEBI regulatory framework is the gold standard among developing market mutual fund regulators – with mandatory expense ratio disclosure, direct plan requirements, and real-time NAV publication protecting retail investors better than most developing market equivalents.
The 4 Biggest Mutual Fund Return Mistakes
Mistake 1: Chasing Last Year’s Top Performer
The fund that delivered 35% last year is almost never the fund that delivers 35% next year. In fact – top performers in any year tend to mean-revert sharply the following year as they run out of momentum. Selecting funds based on 1-year return is the most reliable way to consistently buy high and experience disappointing subsequent returns.
Instead: evaluate funds on 5-year and 10-year rolling returns – performance across multiple market cycles is far more predictive than any single year’s performance.
Mistake 2: Ignoring the Expense Ratio
As demonstrated – a 1.2% expense ratio difference costs ₹18-25 lakhs over 20 years on a ₹10,000/month SIP. Always compare Direct Plan expense ratios before choosing a fund. A fund delivering 16% CAGR at 1.8% expense ratio nets you 14.2%. A fund delivering 15% CAGR at 0.5% expense ratio nets you 14.5%. The apparently lower-returning fund beats the higher-returning one.
Mistake 3: Exiting During Market Corrections
The 10-year CAGR of 17% for mid-cap funds includes multiple 30-40% corrections during that period. Every investor who exited during those corrections – “to protect capital” – locked in losses and missed the recovery that restored and then exceeded their original value. The long-term CAGR is earned only by investors who remain invested through every cycle.
Mistake 4: Over-Diversifying Into Too Many Funds
Many investors buy 12-15 different mutual funds thinking they are diversifying. In reality – most equity funds have 60-80% portfolio overlap with each other. Owning 8 large-cap funds gives you the same exposure as owning 1 large-cap fund at 8x the administrative complexity. Optimal portfolio: 3-5 funds covering different market cap segments and one debt fund for stability.
How to Use the Mutual Fund Returns Calculator: Step by Step
Step 1: Choose Your Investment Type
Select SIP (monthly) or Lumpsum (one-time). Most long-term investors should use SIP – it eliminates market timing risk and builds discipline.
Step 2: Enter Your Amount
SIP: monthly amount (e.g., ₹5,000, ₹10,000, ₹25,000)
Lumpsum: total one-time investment amount
Step 3: Select Fund Category
Choose from the dropdown – Large Cap, Mid Cap, Flexi Cap, ELSS, Debt, Hybrid, etc. The calculator uses category average historical CAGR as the base return rate.
Step 4: Enter Expected Return Rate
The calculator auto-fills the category average – but you can customise based on a specific fund’s historical CAGR if you have identified a fund.
Step 5: Set Your Time Horizon
Enter the number of years you plan to stay invested. Remember – equity mutual funds need minimum 5 years; 7-10+ years to fully benefit from the compounding advantage.
Step 6: View and Compare Results
The calculator shows: total invested, estimated corpus, total gains, and effective CAGR. Switch between categories to see side-by-side comparisons on the same investment.
👉 Related Reading: SIP vs FD vs RD – Which Gives More Returns? → – understanding where mutual fund SIP sits in the broader investment landscape.
👉 Related Reading: Tax-Saving Investment Calculator – 5 Best Options → – how ELSS funds combine wealth building with tax saving.
Frequently Asked Questions
Q: Which mutual fund category gives the best returns in India?
A: Based on 10-year historical data – small cap funds have delivered the highest average returns at 18-19% CAGR, followed by mid cap at 17-18%, and flexi cap at 15-16%. However, higher returns come with higher volatility – small cap funds can fall 40-60% in bear markets. For most investors, a combination of flexi cap and mid cap provides the best balance of strong returns with manageable volatility over 10+ year horizons.
Q: Is it better to invest in direct or regular mutual fund plans?
A: For investors who are comfortable researching and selecting their own funds – direct plans are almost always better. The 0.8-1.5% annual expense ratio saving compounds into ₹15-25 lakhs of additional corpus over 20 years on a ₹10,000/month SIP. Use platforms like Groww, Zerodha Coin, Kuvera, or ET Money for direct plan access. Choose regular plans only if you have a genuine financial advisor providing ongoing, personalised portfolio management worth the additional cost.
Q: How accurate are mutual fund return calculators?
A: Return calculators use historical CAGR as the projected rate – which is the most reasonable assumption available. However, past returns do not guarantee future performance. Market conditions, fund manager changes, regulatory changes, and economic cycles all affect future returns. Use calculator results as planning estimates, not guarantees. Always plan with conservative return assumptions (10-12% for equity) and treat higher actual returns as a bonus.
Q: Can I lose money in mutual funds?
A: Yes – equity mutual fund values fluctuate with market conditions. In any given year, equity funds can lose 20-40% of value. However, over 10-15 year periods – no diversified equity mutual fund category in India has delivered negative overall returns. The risk is not permanent loss – it is temporary volatility. Investors who remain invested through downturns consistently recover and exceed their original investment. The risk management tool is time in market, not timing the market.
Q: How do I calculate my mutual fund SIP returns correctly?
A: Use XIRR (Extended Internal Rate of Return) for the most accurate calculation of your SIP returns. Most mutual fund platforms (Groww, Zerodha, CAMS, KFin) show your XIRR in portfolio reports. XIRR accounts for the different time periods each monthly SIP has been invested – giving your true annualised return. The fund’s advertised CAGR and your personal SIP XIRR will differ – your XIRR reflects your actual investment experience.
Q: How many mutual funds should I have in my portfolio?
A: Most financial experts recommend 3-5 funds for a complete equity portfolio – covering large cap, mid cap or flexi cap, and optionally small cap for aggressive investors. Adding a debt fund or balanced advantage fund completes the portfolio. Beyond 5-6 funds, the additional diversification benefit is minimal while administrative complexity increases significantly. Review your portfolio annually – not monthly – to avoid reactive decisions during market volatility.
Conclusion
The mutual fund returns calculator does not tell you which fund to buy. It tells you something more important: what the difference in fund category choice actually means for your financial future – in precise rupee terms.
The gap between a conservative debt fund investor and a disciplined equity SIP investor over 20 years is not 20% or 50% – it is 200-300% of the final corpus on the same monthly investment. A ₹10,000/month SIP in a liquid fund builds ₹46 lakhs in 20 years. The same ₹10,000/month in a flexi cap fund builds ₹1.37 crores. The same investment. The same 20 years. A difference of ₹91 lakhs.
The three decisions that determine most of this outcome are:
- Choosing equity over debt for long-term goals (time horizon above 7 years)
- Choosing direct plans over regular plans (expense ratio matters enormously)
- Staying invested through every correction (CAGR is earned by those who stay)
Everything else – fund selection within the right category, SIP date optimisation, AMC reputation – matters far less than these three foundational decisions.
Make them correctly. Start today. Let the calculator show you where you will be.
👉 Compare all mutual fund categories with our free Mutual Fund Returns Calculator →
👉 Related Reading: How to Become a Millionaire with SIP Calculator →
👉 Related Reading: SIP vs FD vs RD – Which Gives More Returns? →
👉 Related Reading: Step-Up SIP Calculator – Grow Wealth 3X Faster →
👉 Related Reading: Tax-Saving Investment Calculator – 5 Best Options →
👉 Related Reading: Capital Gains Tax Calculator – Stocks, Property and Crypto →
👉 Related Reading: Retirement Corpus Calculator – How Much Do You Need? →
👉 Related Reading: Lumpsum vs SIP Investment – Which Strategy Wins? →