Here is a truth that most banks and financial institutions would rather you not fully understand:
Your money sitting in a savings account is not safe. It is losing value every single day.
Not dramatically. Not obviously. But silently, consistently, and with mathematical certainty — inflation is eroding the purchasing power of every rupee, peso, naira, and real that is not growing faster than the rate of price increases in your economy.
The threat to your wealth is not a stock market crash. It is not a bank failure. It is the slow, invisible, relentless force of inflation — quietly stealing 5–8% of your money’s value every single year while you think it is sitting safely in your account.
The good news: an investment calculator makes this threat completely visible — and shows you exactly which assets protect and grow your real wealth, and which ones merely create the illusion of safety.
Here is how to use it.
👉 Calculate your real inflation-adjusted returns with our free Investment Returns Calculator →
The Invisible Tax Nobody Voted For
Inflation is often described as a tax — because it reduces the value of your money just as effectively as a tax does, but without any government announcement or your conscious awareness.
When inflation runs at 6% per year, your ₹1,00,000 in savings does not become ₹94,000 in your bank account. It still says ₹1,00,000. But it can only buy what ₹94,000 could buy last year. The number stays the same. The purchasing power quietly shrinks.
Over years and decades, this effect is devastating:
| Amount Today | Inflation Rate | Real Value in 10 Years | Real Value in 20 Years | Real Value in 30 Years | Total Value Destroyed |
|---|---|---|---|---|---|
| ₹5,00,000 | 6% | ₹2,79,197 | ₹1,55,927 | ₹87,022 | ₹4,12,978 (82.6%) |
| ₹10,00,000 | 6% | ₹5,58,395 | ₹3,11,855 | ₹1,74,110 | ₹8,25,890 (82.6%) |
| ₹20,00,000 | 7% | ₹10,16,769 | ₹5,16,810 | ₹2,62,650 | ₹17,37,350 (86.9%) |
| ₹50,00,000 | 8% | ₹23,16,054 | ₹10,73,565 | ₹4,97,630 | ₹45,02,370 (90.0%) |
Read those numbers carefully: ₹50 lakhs in a savings account at 3.5% interest, in an economy running 8% inflation, loses 90% of its real purchasing power in 30 years.
That is not a theoretical risk. That is mathematics — and it is happening right now to savings across every developing market economy in the world.
👉 See exactly how inflation is eroding your savings with our Purchasing Power Calculator →
Understanding Real Return: The Only Number That Matters
Most people focus on the nominal return — the percentage their bank or fund house advertises. But the nominal return tells you almost nothing about whether you are actually building wealth.
The number that matters is the real return — your nominal return minus inflation.
Real Return = Nominal Return − Inflation Rate

Examples (India 2025, inflation ~5–6%):
Savings Account:  3.5% − 6% = −2.5% real return
Fixed Deposit:    7.0% − 6% = +1.0% real return
Equity SIP:      12.0% − 6% = +6.0% real return
Real Estate:     10.0% − 6% = +4.0% real return
Gold:             8.0% − 6% = +2.0% real return
A negative real return means your wealth is shrinking in purchasing power even as the nominal number grows. A positive real return means your wealth is genuinely increasing — you can buy more with it next year than you can today.
| Investment | Nominal Return | Inflation | Real Return | Verdict |
|---|---|---|---|---|
| Cash at home | 0% | 6% | −6.0% | Wealth destruction guaranteed |
| Savings Account | 3.5% | 6% | −2.5% | Losing purchasing power every year |
| Recurring Deposit | 6.5% | 6% | +0.5% | Barely breaking even in real terms |
| Fixed Deposit | 7.0% | 6% | +1.0% | Marginal real growth — better than nothing |
| Gold | 8.0% | 6% | +2.0% | Moderate inflation hedge |
| Real Estate | 10.0% | 6% | +4.0% | Good inflation protection (location dependent) |
| Equity SIP | 12.0% | 6% | +6.0% | Strongly beats inflation — genuine wealth building |
| Step-Up SIP | 13.0% | 6% | +7.0% | Maximum inflation-beating power |
The savings account is not a safe investment. It is a guaranteed slow-motion purchasing power destruction machine dressed up in the language of security.
How Inflation Devastates Different Savings Vehicles Over 20 Years
Let us make this absolutely concrete with a ₹10,000/month investment comparison — showing both nominal value and real (inflation-adjusted) value:
| Investment | Monthly | Nominal Return | 20-Year Nominal Value | 20-Year Real Value (6% inflation) | Real Wealth Created |
|---|---|---|---|---|---|
| Savings Account | ₹10,000 | 3.5% | ₹34,60,590 | ₹10,78,450 | ₹10,78,450 (vs ₹24L invested) |
| Recurring Deposit | ₹10,000 | 6.5% | ₹54,14,940 | ₹16,87,180 | Slightly ahead of inflation |
| Fixed Deposit | ₹10,000 | 7.0% | ₹52,40,200 | ₹16,32,940 | Marginally above inflation |
| Equity SIP | ₹10,000 | 12.0% | ₹99,91,480 | ₹31,12,600 | ₹31.1 lakhs in TODAY’s purchasing power |
The equity SIP investor ends up with ₹31.1 lakhs in real (today’s equivalent) purchasing power after 20 years. The savings account investor ends up with just ₹10.78 lakhs in real terms — barely above what they actually put in (₹24 lakhs invested).
In real terms, the savings account investor lost purchasing power despite saving diligently for 20 years. The SIP investor more than tripled their real wealth.
👉 See your real vs nominal returns with our free Inflation-Adjusted Investment Calculator →
The Investment Calculator: How to Use It for Inflation Planning
Most people use investment calculators to see how their money grows nominally. The truly powerful use is comparing nominal growth against inflation to understand your real wealth trajectory.
Here is a step-by-step guide to using any investment calculator for inflation planning:
Step 1 — Enter your monthly investment amount Use your actual investable monthly surplus — the amount left after essential expenses and emergency fund contribution.
Step 2 — Enter the expected nominal return
- Savings account: 3.5%
- FD/RD: 6.5–7%
- Debt mutual fund: 7–8%
- Balanced/hybrid fund: 9–10%
- Equity SIP: 10–12%
Step 3 — Set your time horizon Be honest. If the money is for retirement in 25 years, enter 25. Do not underestimate your investment horizon — longer is almost always better for equity.
Step 4 — Note the nominal final value This is the number the calculator shows. It looks impressive.
Step 5 — Apply the inflation deflator Divide the nominal value by (1 + inflation rate)^years to get the real value.
Real Value = Nominal Value ÷ (1.06)^20
Example: ₹99,91,480 ÷ (1.06)^20 = ₹99,91,480 ÷ 3.207 = ₹31,16,000
Step 6 — Compare real values across investment options Now you are comparing apples to apples. The investment that generates the highest real value — not nominal value — is the one that actually builds wealth.
Step 7 — Switch investment vehicles until real value exceeds your goal If your real value is insufficient, you have three levers: invest more monthly, choose a higher-return vehicle, or extend your time horizon. The calculator makes each lever’s impact instantly visible.
Which Investments Beat Inflation in Developing Markets? (2025 Data)
| Country | Average Inflation (2024–25) | Investment | Nominal Return | Real Return | Inflation Beating? |
|---|---|---|---|---|---|
| 🇮🇳 India | 5–6% | Equity SIP | 12% | +6 to +7% | ✅ Strongly |
| 🇮🇳 India | 5–6% | Fixed Deposit | 7% | +1 to +2% | ⚠️ Marginally |
| 🇮🇳 India | 5–6% | Savings Account | 3.5% | −1.5 to −2.5% | ❌ No |
| 🇵🇭 Philippines | 3–4% | Equity UITF | 8–12% | +5 to +8% | ✅ Yes |
| 🇵🇭 Philippines | 3–4% | Time Deposit | 4–5% | +0.5 to +2% | ⚠️ Marginally |
| 🇳🇬 Nigeria | 25–30% | NSE Equities | 20–30% | −5 to +5% | ⚠️ Uncertain |
| 🇳🇬 Nigeria | 25–30% | Treasury Bills | 18–22% | −8 to −7% | ❌ No in real terms |
| 🇧🇷 Brazil | 4–5% | Equity Funds | 12–18% | +8 to +13% | ✅ Strongly |
| 🇧🇷 Brazil | 4–5% | Poupança Savings | 6–7% | +2 to +3% | ⚠️ Barely |
| 🇰🇪 Kenya | 6–8% | NSE Equity | 12–18% | +5 to +10% | ✅ Yes |
| 🇰🇪 Kenya | 6–8% | Fixed Deposit | 10–13% | +3 to +6% | ✅ Marginally to Yes |
Critical Nigeria observation: With inflation running at 25–30%, even Treasury Bills at 18–22% produce negative real returns. In very high inflation economies, USD-denominated assets, commodities, and real estate become more important inflation hedges than local currency fixed income.
👉 Related Reading: SIP vs FD vs RD — Which Gives More Returns in 2025? → — the complete comparison of returns across investment vehicles.
The 5 Best Inflation-Beating Investments for 2025
1. Equity SIP — The Most Powerful Long-Term Inflation Beater
Over any 10+ year period in history, diversified equity mutual funds have beaten inflation by the widest margin of any accessible investment vehicle. The 6–7% real return from equity SIP is not just above inflation — it is compounding above inflation, producing exponential real wealth growth.
Best for: Any financial goal that is 7+ years away. Real return: +5 to +8% above inflation (India) Risk: Medium-high in short term; historically low over 10+ years
👉 Related Reading: How to Become a Millionaire with SIP Calculator →
2. Real Estate — Location-Dependent Inflation Hedge
Property in high-demand locations (growing cities, near infrastructure development, technology corridors) has historically appreciated at or above inflation — while also generating rental income. However, real estate requires large capital, has poor liquidity, and involves significant transaction costs.
Best for: Long-term wealth preservation with 10+ year horizon and sufficient capital. Real return: +2 to +6% above inflation (highly location-dependent) Risk: Concentration, illiquidity, management complexity
3. Gold — The Classic Crisis Hedge
Gold has preserved purchasing power over very long periods (centuries). However, it generates no income and underperforms equities significantly over most 10–20 year periods. Its primary value is as a portfolio diversifier and crisis hedge — not a primary wealth builder.
Best for: 5–10% portfolio allocation as insurance against extreme economic events. Real return: +1 to +3% above inflation (long-term average) Risk: High short-term volatility; no income generation
4. Inflation-Linked Bonds and Government Securities
In some developing markets, government bonds are specifically indexed to inflation — their returns automatically adjust with inflation. Examples include India’s Inflation Indexed National Savings Securities and similar products in Brazil (Tesouro IPCA+).
Best for: Conservative portion of portfolio, especially for those nearing retirement. Real return: +1 to +2% guaranteed above inflation Risk: Very low; backed by government guarantee
5. Step-Up SIP — Inflation-Beating on Steroids
A regular SIP beats inflation. A Step-Up SIP — where you increase your monthly investment by 10% every year — beats inflation by an even wider margin because your investment itself grows at above-inflation rates, compounding the compounding.
Best for: Working professionals who expect regular salary growth. Real return: +7 to +9% above inflation (effective) Risk: Same as regular equity SIP
👉 Related Reading: Step-Up SIP Calculator — Grow Wealth 3X Faster → — the complete guide to implementing Step-Up SIP.
The Inflation-Proof Portfolio: Allocation by Age
No single investment perfectly beats inflation in all conditions. The most resilient strategy diversifies across multiple inflation-beating asset classes — weighted by your age, risk tolerance, and investment horizon.
| Age Group | Equity SIP | Debt Funds / Bonds | Gold | Real Estate / REITs | Reasoning |
|---|---|---|---|---|---|
| 22–30 | 85% | 10% | 5% | 0% | Maximum compounding time justifies maximum equity |
| 30–40 | 75% | 15% | 5% | 5% | Building wealth aggressively, slight diversification |
| 40–50 | 60% | 25% | 10% | 5% | Approaching peak wealth, reduce but maintain growth |
| 50–55 | 50% | 35% | 10% | 5% | Capital preservation becoming important |
| 55–60 | 35% | 45% | 10% | 10% | Income stability priority, but equity essential |
| 60+ | 25% | 55% | 10% | 10% | Inflation protection remains critical even in retirement |
Critical insight for retirees: Even after retirement, you need equity exposure. A 60-year-old with a 25-year life expectancy who invests entirely in FD at 7% while inflation runs at 6% will see their real purchasing power halved by age 85. Maintaining 25–35% equity allocation in retirement is not risky — it is essential for inflation survival over a long retirement.
Inflation Planning: The Goal-Specific Calculator Approach
Different financial goals have different inflation sensitivities. Here is how to use the investment calculator to inflation-proof each major goal:
Child’s Education (15 Years Away)
Current cost of target college: ₹15,00,000
Education inflation rate: 8–10% per year
Cost in 15 years: ₹15,00,000 × (1.09)^15 = ₹54,73,566

Monthly SIP needed to reach ₹54.7 lakhs in 15 years (12% return):
≈ ₹10,840/month
Without inflation adjustment, most parents plan for ₹15 lakhs — and arrive at goal time to find they are ₹39 lakhs short. Always use the inflation-adjusted target when using an investment calculator for education goals.
Retirement Corpus (25 Years Away)
Current monthly expenses: ₹50,000
Inflation rate: 6%
Monthly expenses at retirement: ₹50,000 × (1.06)^25 = ₹2,14,594/month
Annual retirement expenses: ₹25,75,128
Inflation-adjusted FIRE corpus (25x): ₹6,43,78,200

Monthly SIP needed (25 years, 12% return): ₹33,974/month
Without inflation adjustment, a retirement calculator might suggest saving for ₹1.5 Crore — which sounds comfortable but is actually severely underfunded in real terms.
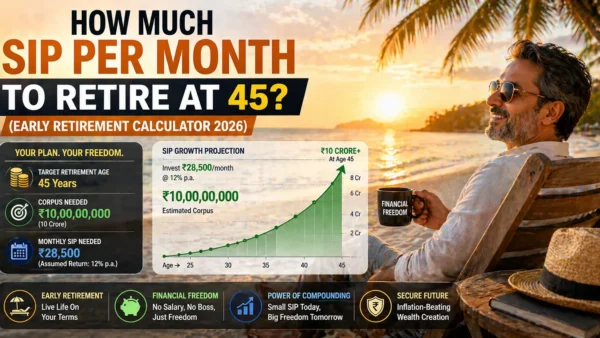
👉 Related Reading: How Much SIP Per Month to Retire at 45? → — the complete inflation-adjusted retirement planning guide.
Emergency Fund (Ongoing)
Your emergency fund (3–6 months expenses in FD) also needs annual inflation adjustment. If your monthly expenses are ₹40,000 today, your emergency fund should be ₹2.4 lakhs (6 months). At 6% inflation, this should grow to ₹2.54 lakhs by next year — requiring you to add approximately ₹14,400 to your emergency FD annually just to maintain its real value.
The Salary Trap: Why High Earners Still Lose to Inflation
A common misconception: “I earn well, so inflation doesn’t really affect me.”
This misses a critical point. Inflation erodes the purchasing power of accumulated savings — not just current income. A high earner who saves ₹50 lakhs in a savings account over their career loses more in absolute rupee terms to inflation than a lower earner with ₹5 lakhs saved — because the absolute amount being eroded is larger.
| Person | Savings Accumulated | Savings Vehicle | Annual Inflation Loss (6%) | 20-Year Real Value |
|---|---|---|---|---|
| High earner | ₹50,00,000 | Savings account (3.5%) | ₹1,25,000/year real loss | ₹15,59,270 |
| High earner | ₹50,00,000 | Equity portfolio (12%) | +₹3,00,000/year real gain | ₹1,55,93,500 |
| Difference | ₹1,40,34,230 |
The high earner who invests in equity rather than keeping money in savings ends up with ₹1.4 crore more in real wealth on the same ₹50 lakh — simply by choosing the right vehicle.
High income is only valuable if the accumulated savings are deployed into inflation-beating assets.
Actionable 5-Step Inflation Protection Plan for 2025
Step 1 — Calculate your current real return. Add up all your savings and investments. Calculate the weighted average nominal return. Subtract your country’s current inflation rate. If your real return is negative or below 2%, you have an inflation problem that needs immediate action.
Step 2 — Move savings account surplus into an equity SIP. Keep only 1–2 months of expenses in a savings account for daily liquidity. Move all surplus beyond your emergency fund into equity SIP. Use our Investment Calculator to model the difference over your horizon.
Step 3 — Inflation-adjust all your financial goals. Every financial goal — retirement, education, home down payment, travel fund — should be calculated at its future inflation-adjusted value, not today’s cost. Use 6–8% inflation for developing markets.
Step 4 — Implement Step-Up SIP to outpace inflation compounding. Increase your SIP by at least 6–8% annually to counteract inflation’s effect on your investment’s real value over time. A flat ₹10,000/month SIP is worth less in real terms each year — the Step-Up counteracts this.
Step 5 — Review your real return annually. Every January, calculate your portfolio’s real return for the past year. If your real return has dropped below 4%, rebalance toward higher-return assets. If inflation has spiked (as in Nigeria, Pakistan), consider increasing equity and commodity exposure to compensate.
Frequently Asked Questions
Q: What is the inflation rate in India and other developing markets in 2025? A: India’s CPI inflation has been running at approximately 4–6% in 2024–25, moderating from earlier highs. Other developing markets face higher rates: Nigeria 25–30%, Pakistan 20–28%, Kenya 6–8%, Brazil 4–5%, Philippines 3–4%. Always use your local current inflation rate when using investment calculators for financial planning — a 6% assumption for Nigeria massively understates the threat.
Q: Is gold a reliable inflation hedge? A: Gold is a moderate, long-term inflation hedge — it has broadly preserved purchasing power over very long periods (decades to centuries). However, over most 10–20 year investment periods, gold significantly underperforms equity in real terms. Gold’s value is primarily as a crisis and currency debasement hedge — not as a primary wealth builder. A 5–10% gold allocation provides useful portfolio insurance without sacrificing overall returns.
Q: Should I invest in real estate to beat inflation? A: Real estate can beat inflation over the long term — but it requires large capital, has very poor liquidity, and carries significant location-specific risk. In most major Indian metros, gross rental yields of 2.5–3.5% do not beat inflation on their own — capital appreciation must do the heavy lifting. In high-yield markets (Nairobi 6–8%, Lagos 7–10%), real estate makes a stronger inflation-beating case. For most investors, a Real Estate Investment Trust (REIT) provides property exposure with vastly better liquidity and lower capital requirements.
Q: How often should I increase my SIP to keep up with inflation? A: Annually — and the increase should be at minimum equal to the inflation rate, ideally equal to your salary increase percentage. If inflation is 6% and you keep your SIP flat, your investment’s real value is falling each year. A 10% annual Step-Up SIP comfortably outpaces 6% inflation while building accelerating wealth through the compounding effect.
Q: My FD gives 7% and inflation is 6% — am I really losing money? A: In nominal terms, no — your balance grows by 7% annually. In real terms, you earn just 1% above inflation. But the bigger issue is taxation: FD interest is taxed as income (up to 30% for high earners), reducing your after-tax return to approximately 4.9% — which is actually below inflation at 6%. After tax, a 30% bracket FD investor is genuinely losing real purchasing power even at 7% interest. Equity SIP, taxed at LTCG 12.5% only on gains above ₹1.25 lakh at redemption, has a dramatically better after-tax real return.
Q: What is the safest inflation-beating investment for someone close to retirement? A: For investors 3–5 years from retirement, a combination of 40–50% balanced advantage funds (auto-adjust equity/debt based on valuations), 30–40% short-term debt funds, and 10–15% gold provides inflation-beating potential with managed downside risk. Pure FD at this stage exposes you to significant inflation risk over a potentially 25–30 year retirement period. Maintaining equity exposure is not optional — it is a inflation survival necessity for long retirements.
Conclusion
Inflation is not a problem that happens to other people in other countries. It is happening right now, to every currency, in every economy — including yours.
And the response is not to panic, hoard gold, or move to foreign currencies. The response is to invest in assets whose returns consistently exceed inflation — which the data overwhelmingly identifies as equity mutual funds for most investors with a 7+ year horizon.
The investment calculator is your most powerful tool in this battle. It transforms inflation from an abstract threat into a concrete number — showing you exactly how much purchasing power you are gaining or losing each year, and exactly which investment changes would transform your real wealth trajectory.
Use it not just to see how your money grows — use it to understand whether it is truly growing in real terms, or merely appearing to grow while silently shrinking.
The difference between these two outcomes — played out over 20–30 years — is measured not in thousands, but in crores.
👉 Calculate your real inflation-adjusted returns with our free Investment Returns Calculator → 👉 Related Reading: SIP vs FD vs RD — Which Gives More Returns in 2025? → 👉 Related Reading: Compound Interest Calculator — The 8th Wonder of the World → 👉 Related Reading: How to Become a Millionaire with SIP Calculator → 👉 Related Reading: How Much SIP Per Month to Retire at 45? → 👉 Related Reading: Step-Up SIP Calculator — Grow Wealth 3X Faster → 👉 Related Reading: Tax-Saving Investment Calculator — 5 Best Options for 2025 → 👉 Related Reading: Lumpsum vs SIP Investment — Which Strategy Wins? →