Every time you buy a packet of biscuits in India, you pay 5% GST. Buy the same snack in Germany, you pay 7% VAT. In Brazil, the same purchase triggers three different taxes simultaneously. In Singapore, you pay just 9% on almost everything.
Why do consumption taxes differ so dramatically across countries? What is the actual difference between GST and VAT? And which countries have structured their systems most efficiently for businesses and consumers?
Whether you are a business owner exploring international markets, a traveller trying to understand foreign tax refunds, or simply a curious person who wants to understand the global tax landscape — this complete 2025 comparison gives you every answer.
👉 Calculate consumption tax on any transaction in any country with our free International Tax Calculator →
GST vs VAT: What Is Actually Different?
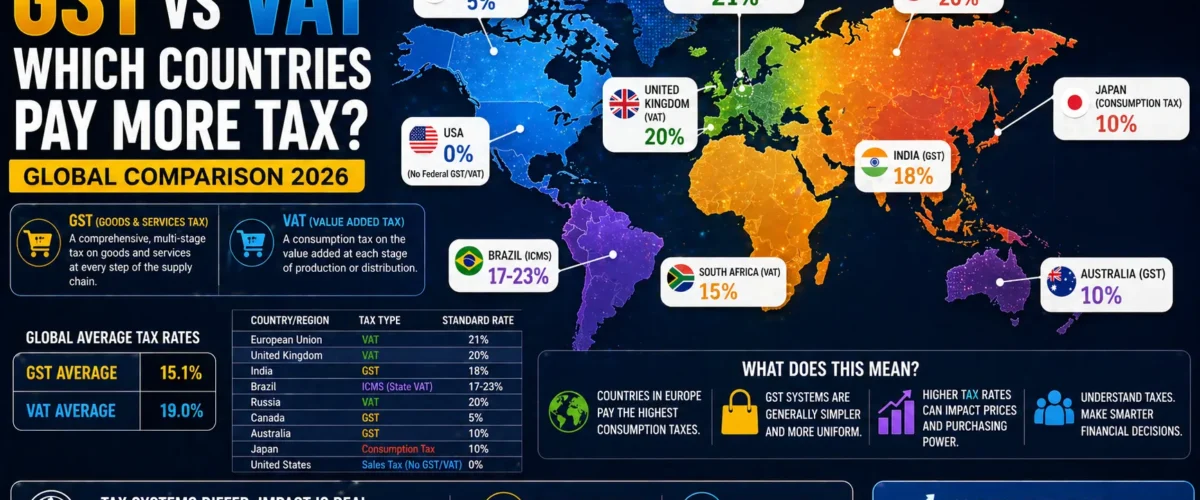
The terms GST and VAT are often used interchangeably — but they describe subtly different systems with important practical distinctions:
VAT (Value Added Tax) The older system — developed in France in the 1950s and adopted by most of Europe, Africa, and many developing markets. VAT is typically applied at each stage of production and distribution. Different rates often apply to goods vs services — with services sometimes taxed separately under a different framework.
GST (Goods and Services Tax) A more modern evolution of VAT — designed to eliminate the complexity of having separate taxes on goods and services. GST unifies both under a single system with consistent rates and a seamless Input Tax Credit mechanism. Countries that adopted GST (India, Australia, Canada, New Zealand) generally have simpler tax administration than those on traditional multi-rate VAT systems.
| Feature | VAT (Traditional) | GST (Modern Unified) |
|---|---|---|
| Coverage | Primarily goods; services taxed separately in many countries | Goods AND services in single unified system |
| Tax Stages | Collected at each production stage | Collected at each supply chain stage |
| Input Credit | Available but administration varies | Seamless ITC across all stages |
| Rate Structure | Often separate rates for goods vs services | Single set of rates for both |
| Administration | Can be complex with separate service tax | Simpler — single registration, unified filing |
| Examples | EU countries, UK, most of Africa | India, Australia, Canada, New Zealand, Singapore |
| Cascading Effect | Risk of tax-on-tax in some structures | Largely eliminated through ITC |
The practical truth: In most countries, GST and VAT function similarly at the transaction level — both add a percentage to the price and allow businesses to recover input tax. The main difference is structural simplicity and completeness of coverage. India’s pre-2017 system was a classic example of VAT complexity — with excise, service tax, state VAT, entry tax, and octroi all coexisting, creating the infamous “cascading” tax-on-tax problem. GST eliminated all of this.
Global GST/VAT Rates: The Complete 2025 Reference Table
| Country/Region | Tax System | Standard Rate | Food Rate | Services Rate | Notable Features |
|---|---|---|---|---|---|
| ASIA | |||||
| 🇮🇳 India | GST | 18% (standard) | 0–12% | 18% | 5-slab system: 0, 5, 12, 18, 28% |
| 🇯🇵 Japan | Consumption Tax | 10% | 8% (reduced) | 10% | Reduced rate for food and beverages |
| 🇨🇳 China | VAT | 13% | 9% (food) | 6% (services) | Multiple rates by industry |
| 🇸🇬 Singapore | GST | 9% | 9% | 9% | Single rate on almost everything; increased from 8% in 2024 |
| 🇲🇾 Malaysia | SST (Sales & Service Tax) | 10% (sales) / 8% (service) | 0% (most food) | 8% | Reverted from GST to SST in 2018 |
| 🇹🇭 Thailand | VAT | 7% | 0% | 7% | Reduced from standard 10%; regularly extended |
| 🇮🇩 Indonesia | PPN (VAT) | 12% | 0% | 11% | Increased from 11% in January 2025 |
| 🇵🇭 Philippines | VAT | 12% | 0% | 12% | Senior citizens get 20% discount on most goods |
| 🇻🇳 Vietnam | VAT | 10% | 5–10% | 10% | Periodic 2% reductions under support measures |
| 🇰🇷 South Korea | VAT | 10% | 0–10% | 10% | Single rate with limited exemptions |
| MIDDLE EAST | |||||
| 🇸🇦 Saudi Arabia | VAT | 15% | 0% (basic food) | 15% | Tripled from 5% in July 2020 |
| 🇦🇪 UAE | VAT | 5% | 0% (basic food) | 5% | Introduced in 2018; one of world’s lowest |
| 🇶🇦 Qatar | No VAT | 0% | 0% | 0% | No consumption tax currently |
| 🇧🇭 Bahrain | VAT | 10% | 0% | 10% | Doubled from 5% in 2022 |
| AFRICA | |||||
| 🇳🇬 Nigeria | VAT | 7.5% | 0% (basic food) | 7.5% | Among Africa’s lowest rates |
| 🇿🇦 South Africa | VAT | 15% | 0% (basic food) | 15% | Increased from 14% in 2018 |
| 🇰🇪 Kenya | VAT | 16% | 0% | 16% | Fuel VAT was controversial |
| 🇬🇭 Ghana | VAT | 21.9% (effective) | 0% | 21.9% | Includes NHIL (2.5%) and GETFund (2.5%) levies |
| 🇪🇬 Egypt | VAT | 14% | 0–14% | 14% | Replaced Sales Tax in 2016 |
| 🇲🇦 Morocco | VAT | 20% | 0–10% | 20% | Multiple rates by category |
| LATIN AMERICA | |||||
| 🇧🇷 Brazil | ICMS + ISS + IPI | 17–19% (ICMS avg) | 0–12% | 2–5% (ISS) | Most complex in world — 3+ separate taxes |
| 🇲🇽 Mexico | IVA | 16% | 0% | 16% | Border areas 8%; food/medicine zero-rated |
| 🇦🇷 Argentina | IVA | 21% | 10.5% | 21% | One of South America’s highest |
| 🇨🇴 Colombia | IVA | 19% | 0% | 19% | Increased from 16% in 2017 |
| 🇨🇱 Chile | IVA | 19% | 19% | 19% | Flat rate on almost everything including food |
| 🇵🇪 Peru | IGV | 18% | 0% | 18% | Food exemptions significant |
| DEVELOPED MARKETS | |||||
| 🇺🇸 USA | State Sales Tax | 0–10.5% | Varies by state | Varies | No federal VAT/GST — state and local taxes only |
| 🇦🇺 Australia | GST | 10% | 0% (fresh food) | 10% | Clean system; fresh food exempt |
| 🇨🇦 Canada | GST/HST | 5% (GST) / 13–15% (HST) | 0% (basic groceries) | 5–15% | Provincial harmonisation varies |
| 🇬🇧 UK | VAT | 20% | 0% (food) | 20% | 5% for energy; zero for children’s clothes |
| 🇩🇪 Germany | MwSt (VAT) | 19% | 7% | 19% | EU harmonised framework |
| 🇫🇷 France | TVA | 20% | 5.5–10% | 20% | Birthplace of VAT (1954) |
| 🇳🇴 Norway | MVA | 25% | 15% | 25% | Among world’s highest standard rates |
| 🇸🇪 Sweden | Moms | 25% | 12% | 25% | Highest alongside Denmark and Norway |
| 🇭🇺 Hungary | ÁFA | 27% | 5–18% | 27% | World’s highest standard VAT rate |
The GST/VAT Rate Rankings: Who Pays Most and Least?
Countries With Lowest Standard Rates (Most Business-Friendly)
| Rank | Country | Rate | Notes |
|---|---|---|---|
| 1 | Qatar | 0% | No consumption tax at all |
| 2 | UAE | 5% | Introduced 2018; remains very low |
| 3 | Canada (GST only) | 5% | HST higher in harmonised provinces |
| 4 | Thailand | 7% | Regularly reduced from 10% standard |
| 5 | Nigeria | 7.5% | One of Africa’s lowest |
| 6 | Australia | 10% | Clean system with food exemption |
| 7 | Japan | 10% | Reduced rate for food/beverages |
| 8 | Singapore | 9% | Clean single-rate system |
| 9 | Indonesia | 12% | Recently increased from 11% |
| 10 | Philippines | 12% | Regional competition for investment |
Countries With Highest Standard Rates
| Rank | Country | Rate | Notes |
|---|---|---|---|
| 1 | Hungary | 27% | EU’s highest and world’s highest standard rate |
| 2 | Norway, Sweden, Denmark | 25% | Nordic model — high rates fund comprehensive welfare |
| 3 | Iceland | 24% | Nordic pattern |
| 4 | Greece, Finland, Ireland | 24–23% | Post-financial crisis rate increases |
| 5 | Croatia, Poland | 25% | EU Eastern Europe high rates |
| 6 | Argentina | 21% | Latin America’s highest mainstream rate |
| 7 | UK | 20% | Post-Brexit rate maintained |
| 8 | France, Germany, Italy | 20–22% | Core EU rates |
| 9 | Ghana (effective) | 21.9% | Multiple levies combined |
| 10 | Morocco | 20% | North Africa high rate |
The Real Tax Burden: Standard Rate vs Effective Rate
The standard rate tells only part of the story. What matters for households and businesses is the effective rate — accounting for exemptions on essential goods, multiple rate tiers, and specific sectoral reliefs.
| Country | Standard Rate | Food Rate | Essential Medicines | Effective Rate on Typical Household Basket |
|---|---|---|---|---|
| 🇮🇳 India | 18% | 0–5% | 0–5% | ~8–10% (food heavy basket) |
| 🇦🇺 Australia | 10% | 0% | 0% | ~6–7% (food exempt) |
| 🇸🇬 Singapore | 9% | 9% | 9% | ~9% (flat single rate) |
| 🇬🇧 UK | 20% | 0% | 0% | ~12–14% (food/children exempt) |
| 🇩🇪 Germany | 19% | 7% | 7% | ~13–15% |
| 🇨🇱 Chile | 19% | 19% | 19% | ~19% (no exemptions) |
| 🇳🇴 Norway | 25% | 15% | 15% | ~18–20% |
India’s multi-rate GST system — with zero rate on essentials and 5% on basics — produces an effective household tax burden of only 8–10% despite the headline 18% standard rate. This progressive structure makes India’s GST system relatively consumer-friendly compared to flat-rate systems like Chile or Singapore.
How India’s GST Compares to Global Peers: A Detailed Analysis
India’s GST system is unique in several ways — both advantageous and complex:
India’s GST Advantages
Advantage 1 — Five-Slab Structure Protects the Poor The 0–5% rates on food staples, healthcare, and essential services ensure that basic consumption by lower-income households is largely tax-free. This is more progressive than Singapore’s flat 9% on everything.
Advantage 2 — Unified National Market Pre-GST India had state-level entry taxes and octroi that created 29 different tax jurisdictions. GST unified the entire country into a single market — reducing compliance costs for businesses operating across states dramatically.
Advantage 3 — Comprehensive ITC Chain India’s GST includes both goods and services in the ITC chain — unlike some VAT systems that handle services separately. This eliminates the cascading tax-on-tax effect that plagued the pre-GST system.
Advantage 4 — Digital Infrastructure (GST Network) The GSTN (GST Network) portal, e-invoicing mandate, and e-way bill system have digitised business tax compliance to a degree that many developed countries have not matched. Real-time invoice matching reduces tax evasion significantly.
India’s GST Challenges
Challenge 1 — Too Many Rate Slabs The 5-slab structure (0, 5, 12, 18, 28%) creates classification disputes — businesses and the government frequently disagree on which rate applies to specific products. Australia’s single 10% rate is dramatically simpler.
Challenge 2 — High Standard Rate India’s 18% standard rate is higher than most comparable developing markets — Malaysia (10%), Thailand (7%), Indonesia (12%), Philippines (12%). This affects competitiveness for services exports and consumer prices.
Challenge 3 — Compliance Complexity Multiple return types (GSTR-1, GSTR-3B, GSTR-9, GSTR-9C), monthly filing requirements, and the GSTR-2B reconciliation burden create significant compliance costs for small businesses.
Challenge 4 — Excluded Sectors Petroleum products, alcohol, electricity, and real estate are kept outside GST — maintained under state-level VAT systems. This creates the old cascading problem for these sectors and limits the seamlessness of the system.
👉 Related Reading: GST Calculator — How GST Affects Your Business Profits → — the complete guide to managing GST for your Indian business.
Brazil: The World’s Most Complex Consumption Tax System
Brazil deserves special attention — its consumption tax system is widely considered the most complex in the world:
| Tax | Level | What It Covers | Rate |
|---|---|---|---|
| ICMS | State | Goods and some services | 17–19% (varies by state) |
| ISS | Municipal | Services | 2–5% (varies by city) |
| IPI | Federal | Industrial products | 0–300% (varies by product) |
| PIS | Federal | Revenue-based social contribution | 1.65% (non-cumulative) |
| COFINS | Federal | Revenue-based social contribution | 7.6% (non-cumulative) |
A typical Brazilian manufacturer faces 5–6 different consumption taxes on a single transaction — each with different rates, different calculation bases, different filing requirements, and different administrative authorities.
The effective total tax burden on business-to-business transactions in Brazil can reach 35–45% of the transaction value — before income tax is even considered.
Brazil’s Tax Reform (2024–2033): The Brazilian government approved a historic constitutional tax reform in December 2023 that will gradually replace all five consumption taxes with two new unified taxes:
- CBS (federal equivalent of GST): replacing PIS, COFINS, and IPI
- IBS (state/municipal equivalent): replacing ICMS and ISS
- IS (Selective Tax on harmful goods): replacing part of IPI
The transition period runs from 2026 to 2033. When complete, Brazil’s system will resemble India’s GST far more closely — dramatically simplifying one of the world’s most burdensome tax environments.
VAT Refunds for Tourists: The Traveller’s Guide
Most countries with VAT/GST allow tourists to claim refunds on goods purchased during their visit — since the tax is designed for domestic consumption and tourists export the goods.
| Country | Tourist VAT Refund? | Minimum Purchase | Refund % | Process |
|---|---|---|---|---|
| 🇬🇧 UK | No (removed post-Brexit 2021) | — | — | Abolished |
| 🇩🇪 Germany | Yes | €50 per store | 7–15% | Tax refund at airport kiosks |
| 🇫🇷 France | Yes | €100.01 per store | 12% (after admin) | Détaxe at airport |
| 🇦🇪 UAE | Yes | AED 250 per transaction | 85% of VAT paid | Planet Tax Free kiosks |
| 🇸🇬 Singapore | Yes | S$100 per store (3 receipts) | ~7.7% net | GST Tourist Refund Scheme |
| 🇦🇺 Australia | Yes | A$300 total | ~9% | TRS at airport |
| 🇯🇵 Japan | Yes | ¥5,000 minimum | ~9% | In-store tax-free shopping |
| 🇰🇷 South Korea | Yes | ₩30,000 minimum | ~9% | In-store and airport |
| 🇹🇭 Thailand | Yes | ฿2,000 per store (฿5,000 total) | ~7% | VAT Refund at airport |
| 🇮🇳 India | No general tourist VAT refund | — | — | No standard scheme |
The UAE stands out as having one of the most generous tourist VAT refund systems — with Planet Tax Free kiosks at all major airports and malls, and an 85% refund of the 5% VAT paid. On a ₹1,00,000 of purchases, a UAE tourist can claim approximately ₹4,250 back at the airport.
Japan’s in-store tax-free shopping is particularly convenient — tourists with a passport can simply present it at participating stores and receive tax-free prices immediately, without waiting for an airport refund.
Consumption Tax and Business Decisions: How Global Rates Affect Where Companies Operate
For businesses choosing where to establish operations or register for tax purposes — consumption tax rates and systems are a significant factor:
The Tax-Efficient Business Jurisdiction Analysis
| Jurisdiction | VAT/GST Rate | Complexity | ITC Efficiency | Business Rating |
|---|---|---|---|---|
| Singapore | 9% | Very Low | High | ★★★★★ — Regional HQ favourite |
| UAE | 5% | Low | High | ★★★★★ — MENA business hub |
| Australia | 10% | Low | High | ★★★★ — Clean simple system |
| UK | 20% | Medium | High | ★★★ — High rate but efficient |
| India | 18% standard | High | High | ★★★ — Complex but improving |
| Brazil | 35–45% effective | Very High | Poor | ★★ — Improving with reform |
| Nigeria | 7.5% | Medium | Medium | ★★★ — Low rate advantage |
| Kenya | 16% | Medium | Medium | ★★★ — East Africa hub |
Singapore consistently attracts Asian regional headquarters for multiple reasons — but its simple, low-rate GST system is a meaningful factor in reducing business operational costs and compliance burden.
The Digital Economy and GST/VAT: The 2025 Frontier
One of the most rapidly evolving areas in global consumption taxation is the treatment of digital services — streaming, software, cloud services, and digital content:
| Country | Digital Services Tax | Foreign Provider Obligation | Rate |
|---|---|---|---|
| 🇮🇳 India | GST on OIDAR (Online Information Database Access and Retrieval) | Foreign providers must register and collect | 18% |
| 🇪🇺 EU | VAT on digital services | EU VAT OSS (One Stop Shop) registration | 17–27% (by country) |
| 🇬🇧 UK | VAT on digital services | UK VAT registration required | 20% |
| 🇦🇺 Australia | GST on digital services | Non-resident registration required | 10% |
| 🇸🇬 Singapore | GST on overseas services | Overseas vendor registration | 9% |
| 🇿🇦 South Africa | VAT on electronic services | Foreign supplier registration | 15% |
| 🇰🇪 Kenya | Digital Service Tax | 1.5% on gross revenue | 1.5% |
Netflix, Spotify, Amazon Prime, Google, and every major digital platform must now charge local consumption tax in most jurisdictions — even without a local office. A Netflix subscription in India attracts 18% GST; the same subscription in Singapore attracts 9% GST; in Norway it attracts 25% VAT.
This harmonisation of digital economy taxation is one of the most significant global tax developments of the last decade — and it directly affects the prices consumers pay for digital services worldwide.
Real-World Impact: ₹1,000 Purchase Across Countries
To make global rate differences tangible — here is what ₹1,000 worth of consumer electronics costs in actual tax paid across major markets:
| Country | Tax System | Applicable Rate | Tax on ₹1,000 Equivalent | Total Price |
|---|---|---|---|---|
| Qatar | None | 0% | ₹0 | ₹1,000 |
| UAE | VAT | 5% | ₹50 | ₹1,050 |
| Thailand | VAT | 7% | ₹70 | ₹1,070 |
| Nigeria | VAT | 7.5% | ₹75 | ₹1,075 |
| Singapore | GST | 9% | ₹90 | ₹1,090 |
| Australia | GST | 10% | ₹100 | ₹1,100 |
| Vietnam | VAT | 10% | ₹100 | ₹1,100 |
| Philippines | VAT | 12% | ₹120 | ₹1,120 |
| Indonesia | PPN | 12% | ₹120 | ₹1,120 |
| Egypt | VAT | 14% | ₹140 | ₹1,140 |
| 🇮🇳 India | GST | 18% | ₹180 | ₹1,180 |
| South Africa | VAT | 15% | ₹150 | ₹1,150 |
| Kenya | VAT | 16% | ₹160 | ₹1,160 |
| Mexico | IVA | 16% | ₹160 | ₹1,160 |
| Saudi Arabia | VAT | 15% | ₹150 | ₹1,150 |
| UK | VAT | 20% | ₹200 | ₹1,200 |
| Germany | MwSt | 19% | ₹190 | ₹1,190 |
| France | TVA | 20% | ₹200 | ₹1,200 |
| Argentina | IVA | 21% | ₹210 | ₹1,210 |
| Sweden | Moms | 25% | ₹250 | ₹1,250 |
| Hungary | ÁFA | 27% | ₹270 | ₹1,270 |
The difference between buying electronics in Qatar (₹0 tax) and Hungary (₹270 tax) on a ₹1,000 purchase is 27% — purely in consumption tax. On a ₹10,000 laptop, this is ₹2,700 difference.
Why Developing Markets Have Lower Rates: The Revenue Mix Story
Developing markets typically have lower VAT/GST rates than developed markets — not because they are more generous, but because their revenue structures differ fundamentally:
| Revenue Source | Developing Markets (Avg) | Developed Markets (Avg) |
|---|---|---|
| VAT/GST | 25–30% of tax revenue | 20–25% of tax revenue |
| Income Tax | 15–25% of tax revenue | 30–40% of tax revenue |
| Social Security | 5–15% of tax revenue | 25–35% of tax revenue |
| Corporate Tax | 15–25% of tax revenue | 8–15% of tax revenue |
| Total Tax Revenue (% of GDP) | 15–25% | 30–45% |
Developed markets collect much more tax overall — largely through high income taxes and social security contributions. They can afford higher VAT rates because the overall tax system is more comprehensive and enforced. Developing markets often rely more heavily on consumption taxes (easier to collect at point of sale) and less on income/payroll taxes (harder to enforce with large informal sectors).
Nigeria’s 7.5% VAT rate reflects a small formal economy where tax enforcement is challenging — higher rates would drive more transactions to the informal cash economy. India’s 18% standard rate can exist because the digital GST infrastructure has significantly reduced evasion.
GST in India’s Neighbourhood: The SAARC Comparison
| Country | Tax System | Standard Rate | Food Exemption | Key Feature |
|---|---|---|---|---|
| 🇮🇳 India | GST | 18% | 0–5% | Most comprehensive system in region |
| 🇵🇰 Pakistan | GST | 18% | 0–10% | Similar rate to India |
| 🇧🇩 Bangladesh | VAT | 15% | 0–5% | Recently reformed system |
| 🇱🇰 Sri Lanka | VAT | 18% | 0% | Significant rate increases in 2022–23 fiscal crisis |
| 🇳🇵 Nepal | VAT | 13% | 0% | Relatively low rate |
| 🇧🇹 Bhutan | GST | 10% | 0% | Relatively new system |
| 🇲🇻 Maldives | GST | 8% | 0% | Tourist GST (16%) higher |
| 🇦🇫 Afghanistan | Sales Tax | 10% | 0% | Simplified system |
India’s 18% standard rate is among the highest in the South Asian region — significantly above Nepal (13%), Bangladesh (15%), and Bhutan (10%). This creates some competitiveness considerations for Indian businesses — particularly in manufacturing and exports — where input costs are higher than regional competitors.
The Future of Global Consumption Taxation: 2025 Trends
Trend 1 — Digital Economy Harmonisation The OECD’s BEPS (Base Erosion and Profit Shifting) framework is pushing countries toward consistent digital services VAT — ensuring that Netflix, Google, and Amazon pay consumption tax in every country where they have customers, regardless of headquarters location.
Trend 2 — Carbon Tax Convergence with VAT Several EU countries are experimenting with carbon-adjusted VAT — applying higher consumption taxes to carbon-intensive goods. This is likely to spread globally as climate commitments intensify.
Trend 3 — Real-Time Invoice Reporting India’s e-invoicing mandate (now covering businesses above ₹5 crore) is part of a global trend toward real-time VAT reporting — where tax authorities receive invoice data immediately rather than in periodic returns. Italy, Spain, and Brazil are all moving in this direction.
Trend 4 — Rate Convergence in Developing Markets As tax administration improves (particularly through digital tools), developing markets are gradually able to enforce higher rates effectively. Expect GST/VAT rates in Africa and Southeast Asia to gradually increase toward 12–15% over the next decade.
Trend 5 — Cryptocurrency and NFT Taxation Countries are increasingly applying VAT/GST to crypto transactions and NFT sales — but with significant inconsistency globally. India applies 18% GST on crypto exchange services (separate from the 30% income tax on crypto gains). The EU has exempted crypto-to-crypto exchanges from VAT. This inconsistency will resolve as regulatory frameworks mature.
Practical Guide: GST/VAT for Indian Businesses Going Global
For Indian businesses exporting goods or services, or receiving payments from foreign clients — understanding global VAT implications is increasingly important:
Exports from India: Goods and services exported from India are zero-rated under GST — you charge 0% GST on exports and can claim a full refund of all input GST paid on inputs used to produce the exported goods/services. This makes Indian exports globally competitive on the tax dimension.
Importing into India: Goods imported into India attract IGST (equal to the applicable GST rate) plus customs duty on the CIF (Cost + Insurance + Freight) value. This IGST is claimable as ITC by registered importers — ensuring no cascading effect for business importers.
Foreign clients (B2B services): When you provide services to a GST-registered foreign business — these are treated as exports (zero-rated). The foreign business handles their own VAT in their country. You charge no GST and claim ITC refund on inputs.
Foreign clients (B2C services): When you provide services directly to unregistered foreign individuals — for some categories (OIDAR — Online Information Database Access and Retrieval), you may need to register for VAT in the destination country. This varies by service type and destination.
The EU VAT OSS: Indian businesses providing digital services to EU consumers must register for EU VAT (via the One Stop Shop) and collect and remit VAT at the applicable rate in each EU member state where they have customers. Above €10,000 annual EU revenue threshold, this becomes mandatory.
Frequently Asked Questions
Q: What is the main difference between GST and VAT? A: GST is a more modern, unified version of VAT that covers both goods and services under a single system. Traditional VAT often treats goods and services separately, sometimes with different tax authorities and rates. GST systems typically have better input tax credit chains and simpler administration. In practice, both collect tax at each stage of supply and allow businesses to recover input tax — the difference is mainly structural efficiency.
Q: Why does India have such a complex GST system with 5 rate slabs? A: India’s multi-slab system reflects the country’s income diversity and political considerations. A single flat rate (like Australia’s 10%) would be regressive — the poor spend a higher proportion of income on food and essentials. Multiple slabs allow zero-rating of necessities, low rates on basics, and higher rates on luxury goods — creating a more progressive structure. The trade-off is complexity in classification and compliance.
Q: Which country has the most business-friendly consumption tax? A: Singapore consistently ranks highest for business-friendly GST — single flat rate of 9%, clean ITC system, simple annual filing for smaller businesses, and no exemption complexity. Australia (10%, clean) and UAE (5%, simple) are also highly rated. For developing markets, Nigeria’s 7.5% and Thailand’s 7% offer competitive rates.
Q: Can I claim VAT back as a tourist in India? A: India does not currently have a standardised tourist VAT/GST refund scheme for exported goods. Unlike UAE, Singapore, Australia, and most EU countries — Indian tourists cannot get GST refunded at the airport. There have been proposals to introduce such a scheme, but it has not been implemented as of 2025.
Q: Why is Brazil’s tax system so complex? A: Brazil’s complexity is historical — different taxes were introduced by different governments at federal, state, and municipal levels over decades, each serving specific political and fiscal purposes. The result is five overlapping consumption taxes that create enormous compliance burden. Brazil’s 2023 constitutional tax reform aims to replace all five with two unified taxes by 2033.
Q: How does India’s GST rate compare globally for services? A: India’s 18% GST on services is relatively high compared to regional peers — Thailand (7%), Indonesia (11%), Singapore (9%), and Philippines (12%) all charge lower rates on services. This can affect competitiveness for Indian IT and professional services exports to customers who do not benefit from the zero-rating of exports.
Conclusion
The global GST/VAT landscape in 2025 reflects a world of enormous tax diversity — from Qatar’s zero consumption tax to Hungary’s 27% standard rate, with every conceivable variation in between.
The key takeaways for different audiences:
For Indian businesses: India’s 18% standard GST rate is among the highest in Asia for services. Exports are zero-rated — a major competitive advantage. The ITC system is comprehensive but compliance is complex. The system continues to mature rapidly.
For international businesses: Singapore and UAE remain the most tax-efficient jurisdictions for consumption tax in Asia and Middle East respectively. Brazil’s reform is proceeding but will take until 2033 to fully implement. Digital services now attract VAT/GST in almost every major market.
For consumers and travellers: Qatar and UAE offer the lowest consumption tax environments. Nordic countries and Hungary have the highest. Tourist VAT refunds are valuable — particularly in UAE (85% refund), Japan (in-store tax-free), and Australia.
For investors: Countries with lower consumption tax rates and simpler systems (Singapore, UAE, Australia) tend to attract more foreign direct investment in services — a pattern that will continue as digital economy taxation spreads.
The global direction is clear: more countries are adopting GST-style unified systems, digital services are being brought into the VAT net everywhere, and compliance is becoming increasingly real-time and digital. Understanding these trends is no longer just for tax professionals — it is essential knowledge for any business operating in the modern global economy.
👉 Calculate consumption tax on any transaction in any country with our free International Tax Calculator → 👉 Related Reading: GST Calculator — How GST Affects Your Business Profits → 👉 Related Reading: Income Tax Calculator 2025 — Save Maximum Tax Legally → 👉 Related Reading: Capital Gains Tax Calculator — Stocks, Property & Crypto → 👉 Related Reading: Tax-Saving Investment Calculator — 5 Best Options for 2025 → 👉 Related Reading: Salary After Tax Calculator — What’s Your Real Take-Home? → 👉 Related Reading: How to Save Tax Using Home Loan — Complete Guide →